Welcome to the 2nd MTGATracker Report; a report in which we explore the aggregated game data collected from MTGA players using MTGATracker! This series will be published both once per set with an in depth look into the prior seasons meta, as well as monthly (once we finish development on other, slightly more exciting things).
New Features!
For those of you that read our Dominaria Meta Report, you’ll notice a few newfeatures here. We are now using Tableau to produce some of our visualizations which greatly increases the ways we can display data, the amount of data we can show, and how you can interact with the data.
Why another meta report?
MTG Arena is young, but there are already a few great meta reports out there, written by really smart people. However, these reports are generated by humans using a limited set of unpublished data sources, and generally omit the methodology of collection. While it’s great to have human authors analyzing the meta from their perspectives, it is possible that even a group of contributors as large as ten or more will only see a subset of the full meta. We humans tend to be biased, fallible, and error-prone creatures (and gosh darn it if we don’t love good dragon art), so it’s also possible that individual authors may be writing about the decks they find the most interesting or appealing, rather than capturing the true state of the meta.
So… Why another meta report (and more importantly, why this one)? Well, the MTGATracker Report is backed by hard data, collected from a large and growing number of users. Our authors may choose to write about the things they find most interesting, but for everyone else, the data can tell it’s own story.
High-level Analysis
Report Volume
| Format | Games Tracked |
|---|---|
| Total | 166,538 |
| Limited† | 23,057 |
| Other Non-Standard Formats | 4,580 |
| Constructed† | 82,476 |
| Not Recorded | 56,425 |
Below are the counts of games within each format broken down by their event ID.
| Format | Event ID | # of Games |
|---|---|---|
| Constructed | Brewers_M19_07262018 | 1,958 |
| Constructed | CompCons_DOM_06072018 | 589 |
| Constructed | CompCons_M19_07122018 | 5,264 |
| Constructed | ConstructedRanked1 | 52,192 |
| Constructed | Constructed_BestOf3 | 3,795 |
| Constructed | Festival_DOM_07062018 | 451 |
| Constructed | Quick_constructed_april_26 | 17,856 |
| Constructed | StressTest_Constructed | 371 |
| Constructed | Total | 82,476 |
| Limited | CompDraft_DOM_06072018 | 94 |
| Limited | CompDraft_DOM_09062018 | 2,077 |
| Limited | CompDraft_M19_07122018 | 3,448 |
| Limited | M19_StressTest_Draft | 1,154 |
| Limited | QuickDraftExploration_M19_09142018 | 126 |
| Limited | QuickDraft_AER_07122018 | 382 |
| Limited | QuickDraft_AKH_08092018 | 1,785 |
| Limited | QuickDraft_DOM_07052018 | 780 |
| Limited | QuickDraft_DOM_08022018 | 2,327 |
| Limited | QuickDraft_DOM_08302018 | 2,268 |
| Limited | QuickDraft_HOU_06282018 | 27 |
| Limited | QuickDraft_HOU_07192018 | 731 |
| Limited | QuickDraft_M19_07262018 | 3,350 |
| Limited | QuickDraft_M19_08162018 | 3,195 |
| Limited | QuickDraft_RIX_09132018 | 1,313 |
| Limited | Total | 23,057 |
| Non-Standard Formats | Momir_09212018 | 491 |
| Non-Standard Formats | Pauper_08312018 | 868 |
| Non-Standard Formats | QuickExploration_08242018 | 347† |
| Non-Standard Formats | Quick_Singleton_08092018 | 2,590 |
| Non-Standard Formats | Singleton_06212018 | 62 |
| Non-Standard Formats | TwiceTheLife_09072018 | 157 |
| Non-Standard Formats | Total | 4,515 |
| Not Recorded | Not Recorded | 56,425 |
| Not Recorded | Total | 56,425 |
| Tutorial | NPE | 65 |
| Tutorial | Total | 65 |
| GRAND TOTAL | TOTAL | 166,538 |
In just 75 days the total number of games more than quadrupled! This time around, we are able to be more selective in which games we include in our data set. Among the cool features added into the tool towards the end of the DOM meta, two of this writer’s personal favorite are the tracking of the type of event / match and the “chess” timer & turn counter. By eliminating games which lasted for less 1.2 minutes and or those that lastedf or less than 3 turns, we are to gleam more meaningful insights.
Delete Comment qualifier above and torubleshoot later
Games Over Time
From here on out, the report will focus on M19 meta data (date range 7/12/2018 through 9/24/2018), however it is possible to view prior data from DOM (5/22/2018 through 7/11/2018) through these graphs as well.
It’s unsurprising that the weekends are the most popular days to play MTGA, but it’s a little odd that Tuesdays are also so popular.
Number of Cards per Deck
Download this dataset: [xlsx] [csv]
| Format | Average number of cards per deck |
|---|---|
| Limited | 40.18 |
| Constructed | 60.47 |
| Other Non-Standard Formats | 61.52 |
This data reveals that players tend to keep their deck sizes very tightly close to the minimum required size, on average including less than one extra card in both formats.
| Format | Hero Deck Size | Count of Games |
|---|---|---|
| Constructed | 60 | 73,190 |
| Constructed | 61 | 1,198 |
| Constructed | 62 | 742 |
| Constructed | 63 | 373 |
| Constructed | 64 | 569 |
| Constructed | 65 | 219 |
| Constructed | 66 | 112 |
| Constructed | 67 | 105 |
| Constructed | 68 | 172 |
| Constructed | 69 | 104 |
| Constructed | 70 - 79 | 307 |
| Constructed | 80 - 89 | 26 |
| Constructed | 90 - 99 | 62 |
| Constructed | 100 - 149 | 110 |
| Constructed | 150 - 249 | 113 |
| Constructed | 250 | 20 |
Surprisingly, there are still a considerable number of games where the total number of cards in the deck far exceeds the minimum required. Just imagine if you were playing a Mill deck nd your opponent had 250 cards in their deck? I’m pretty sure that would be an insta-concede for me save for the fact that a 250 card deck is just so novel.
| Format | Hero Deck Size | Count of Games |
|---|---|---|
| Limited | 40 | 20,354 |
| Limited | 41 | 946 |
| Limited | 42 | 342 |
| Limited | 43 | 112 |
| Limited | 44 | 96 |
| Limited | 45 | 74 |
| Limited | 46 | 25 |
| Limited | 47 | 35 |
| Limited | 48 | 42 |
| Limited | 49 | 16 |
| Limited | 50 - 59 | 90 |
| Limited | 60 | 15 |
| Limited | 62 | 2 |
| Limited | 64 | 1 |
Win Rate by Deck Colors
In this section, we calculated the color of the hero’s deck for each game, and then counted how many times that deck won or lost.
IMPORTANT UPDATE While this looks very similar to the the Win Rate chart in our first meta report, it’s not entirely. In the old chart, the hero’s deck faction was displayed on the horizontal axis, whereas in this chart the deck faction that is displayed is the opponents deck. You are probably thinking “wow that’s dumb, how does that help anyone?” Well this actually is an improvement and here is why:
[1] This viz allows you to see how a specific deck, or group of decks, (as defined by card faction) performed against ALL other decks.
- At the top of the visualization is where you select which deck you would like to see stats for.
- For example, if I click Mono-Green, I’ll see the chart update and the title will reflect that Mono-Green had an average win rate of 51.9% throughout its 5,963 games. I also see that Mono-Red was (not surprisingly) the most common matchup representing 727 of these games. Good thing for Mono-Green as the orange cirlce implies that this was a preferrable matchup for them.
- Alternatively, I can also click within a box and drag across to see how all Mono colored decks performed on average.
- In case you were curious this is how the different groups performed which shows hints at the power of good mana-fixing.
- Mono-Colored (excluding Colorless): 53.7%
- Dual-Colored: 51.4%
- Three-Colors: 51.0%
- Four and Five Colors: 48.2%
- In case you were curious this is how the different groups performed which shows hints at the power of good mana-fixing.
[2] Not only do we show you win rate vs all opponents, but you can also look to see which matchups were fastest as well as the average turn count in wins vs losses against each opponent.
- If you leave the viz in its default state, for example, you can see that for all decks that were matched up against Mono-Red opponents in the 18,320 games, games that went longer on average were more likely to result in a win 14.6 turns vs 13.2 turns.
- Additionally in matches that were won, the hero’s deck was on the play 54% of the time, while there hero was on the play in only 44% of the matches that were lost against Mono-Red decks.
Most Frequently-Used Card Colors
In the following visualization(s), we aggregated every card in every deck of every game (excluding all lands) within the time period to find out which cards within each color identity (accounts for mana symbols in card text as well - not just Mana Cost) are used most often.
We built these visualizations to encourage you to click around find out what interesting things the meta is telling you. As suck we have a few recommendations for you before you begin browsing:
- Mouse over the colored sections of each bar to see the Top 5 cards for that cateogry within that color identity
- Instead of showing the Top 5 most used in each category, the viz can show the Top 5 by Avg used in each deck… just change the “Select Top 5 Rank Field” to Average Per Deck (and see how the number of pesky Rat Colonys you slotted in your deck compares to others)
- You can change how the bars are broken down (and colored) by changing the “Breakout By” selection to:
- Creature vs Non-Creature, Non Land
- Standard Card Type (excludes Supertypes such as “Legendary” and classifies considers all artifacts to be artifacts - so artifact creatures like Bomat Courier are still an artifact)
- Card Type (default and most granular)
- Rarity
- Set
- Change the “Number of Colors” filter at the top to only one of the categories to have an easier time comparing the 2+ colored cards
The Coolest Feature:
- If you change the “Card Meta View” selection to “DOM vs M19” you can compare the meta “seasons” side by side!
- A meta season is the time that cards first become avialable in MTG Arena up until the time when a new set is introduced so as of now we have 2 meta “seasons” (the next release will have GRN)
- The sections of the bars represent the % of the total amount of cards within each cateogry.
- Calculating the measures this way has a few advantages but the most obvious being that if one season lasts 1 month longer than others, the data won’t be skewed to whatever was being played more in that season.
- This view can give you some really cool insights as to the more impactful cards that were introduced into the meta
Most Frequently-Used Cards: By Type
In this section, we’ll dig even deeper, and look at specifically which cards get used the most (and the least).
- Percent means percent of the category represented- for example, Aether Hub represents 7.6% of all non-basic lands.
- Average copies per deck means the average number used in any deck that uses at least one of a card.
Thoughts about M19
The release of M19 undoubtedly brought some cool new tools into the Meta, though as you’ll see from other dashboards, Mono-Red, Rakdos, and Azorious Control continued to dominate the meta. That being said, there are some interesting findings here. We are only going to talk high level about the changes in the mono-colored card meta as the purpose of this is to allow you to do some digging and take away your own conclusions!
-
For Mono-Red Cards, the share of creatures to all other non-land cards fell roughly 7 – 8%; these cards were “replaced” by some new planeswalkers (Sarkhan), enchantments (Sarkhan’s Unsealing), and sorceries (Banefire).
-
Mono-Black creatures got an uptick as the support for Zombies increased. Whether or not….
-
Mono-Green changed only slightly, and showed more Gifts of Paradises as Turbo Fog became a thing. It seemed to die towards the end, likely due to the time it took to play out a game.
-
There were more creatures and less enchantments (minus Ajani’s Welcome) being played in Mono-White as life-gain decks proved to be able to withstand the onslaught of the aggressive damage based removal of Mono-Red
-
The biggest change in Mono-Blue came in the form of mill cards such as Millstone, Psychic Corrosion, and Patient Rebuilding. This writer experienced the power of these in limited and was also milled for his first time ever in paper magic, but has yet to see a successful incarnation of this in constructed (and fears that he might). There was however, one other key change in the form of a legendary creature that made another deck a pretty turbulent storm to deal with (pun intended)…
-
… for those living under a rock, we are referring to Sai, Master Thopterist who enabled Mono-Blue Storm to become a thing. Being a deck that relied on cheap artifacts, ETB triggers, and card draw, we saw Prosphetic Prism become the prettiest artifact among the top 5.
For this writer personally, I enjoyed running a Mono-Green shell and splashing for Sarkhan’s Unsealing. I didn’t get many opportunities to play with this deck so I can’t really comment on power, but it definitely was fun to play.

Final Remarks & What’s Next
There were a lot of things we tried to do in this report that didn’t make it to the final draft. We are currently working on a few new exciting features as well as fleshing these dashboards out more and getting them to a point of monthly releases. Among the features are:
- Utilizing supervised machine learning to try and identify deck archetypes to give deeper insights into the types of deck within the meta. This would be an obvious improvement over what we offer now as we can easily imagine multiple types of archetypes for different color combinations.
- Going off the above, we are also working on creating an aggregate view of a decks archetype. In plain terms, it would show what a typical deck of a certain archetype might look like.
For example, this is what a typical Selesnya Token Deck looks like:
- 4x Emara
- 1.3x Divine Visitations
- etc.
- Contests where winners are validated with analytics; maybe with prizes or maybe just for bragging rights – we’ll see!
the visualisations we tried didn’t quite work out (like these very pretty, but also both impossible and quite useless venn diagrams). Some of the things we did do also didn’t tell us quite as much as we would have liked; for example, while the exact decklist comparisons revealed some aspects of player tendencies, they don’t say very much about the state of the ladder. We’re going to keep thinking about different ways we can get more useful info out of this data, and keep improving our process for making these reports. This first round was a pretty grueling, but ultimately fun & challenging experiment that we’re excited to keep refining.
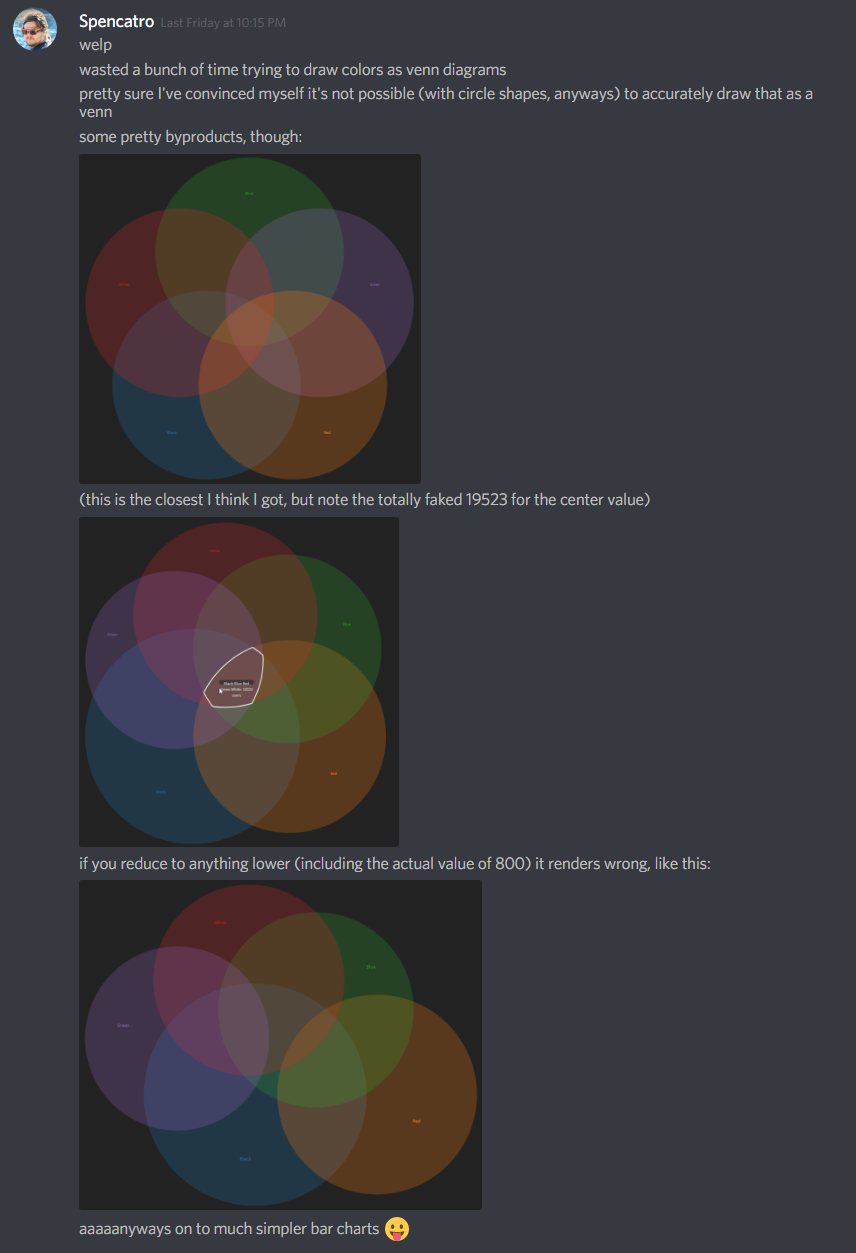
Here are some of the new things we’re already set up to write about in the next data report:
Event Tracking
As of MTGATracker version 3.5.5, we now record the specific event each game takes place in. This means we’ll be able to filter data with even more accuracy.
Cards listed vs. Cards played
MTGATracker now also records which cards a player draws and has the opportunity to play, instead of just recording their entire submitted decklist. We think this will generally be more useful to individual players hoping to determine which cards help propel their own decks to victory, but maybe it will have some use in the aggregate as well.
Timing analyses
We’re really excited about this one! Since MTGATracker now tracks the amount of time each player holds priority, we can use aggregate data to find the “fastest” and “slowest” decks to play. (While I’m sure we can all guess what the former will be (*cough, monored*), it will be fun to get hard data backing it up.)
Deck similarity analyses
These writers 
 are cooking up all kinds of great ideas on how we can better relate decks to each other. While
we found some interesting player habits by looking at exact decklists, this doesn’t tell us as much about
the standard format as we would like. We’re even looking into leveraging crazy things like machine learning &
neural networks to accurately (and exhaustively) categorize the most popular decks in the meta.
are cooking up all kinds of great ideas on how we can better relate decks to each other. While
we found some interesting player habits by looking at exact decklists, this doesn’t tell us as much about
the standard format as we would like. We’re even looking into leveraging crazy things like machine learning &
neural networks to accurately (and exhaustively) categorize the most popular decks in the meta.
Your input?
Have other ideas for metrics we should track and write about? Want to join the meta-report team, and write about the intersection of MTG and Data? Let us know in Discord!
A new meta?!
This one probably goes without saying; it will be interesting to see how much the meta shifts (if at all) with the release of Core 2019.
This writer speculates Red will
continue to dominate, especially with the re-release of Banefire, which will
severely hamper Control’s ability to lock down the game. Additionally, he sees Mono-White becoming an attractive
Aggro deck with the release of Valiant Knight, and even sees it potentially becoming the go-to Aggro deck come rotation.
This writer  just wants to see more dragons.
Addendum: Collection Methodology
All the data shown in this report is real data aggregated from MTGATracker users. When MTGATracker observes the conclusion of a game in MTGA, it uploads some data to MTGATracker servers, including the following (which has been truncated for simplicity):
{
  "players": [{
    "name": "Spencatro",
    "deck": {
      "poolName": "The Brazen Coalition",
      "deckID": "...R3D4CT3D...",
      "cards": {
        "65081": 2,
        "65463": 2,
        "65643": 1,
        // ...
        "66929": 2,
        "67019": 9,
        "67021": 12
     },
    }
  },
  {
    "name": "Opponent's MTGA Username",
    "deck": {
      "poolName": "Opponent's MTGA Username's visible cards",
      "deckID": "unknown",
      "cards": {
        "-1": 39,
        "66003": 2,
        "66009": 1,
        "66029": 1,
        // ...
        "66619": 2,
        "66627": 2,
        "66631": 2
      }
    }
  }]
}
The five digit numbers in these records each refer to a unique MTGA card’s grpId, a unique ID used internally in
MTGA. For these data reports, MTGATracker data scientists (Spencatro and MatteyRitch) write queries against
the MTGATracker database to get the aggregate information shown here. Once we have the aggregate data, we can
decode grpIds using MTGATracker’s open-source mtga python module.
The resulting data sets are then published here, when it is possible to do so without violating individual users’
privacy. (We will never expose a single user’s unique decklist without their express permission!)
Thanks for reading! Until next time… keep trackin’ on! </body>