Editorial Disclaimer
This post was originally published by Spencatro et al. on 07/20/2018. Spencatro has since gone on to work at Wizards of the Coast (Dec 2018). MTGATracker remains a 3rd-party project that is not affiliated with Wizards of the Coast, and is published pursuant to the Wizards of the Coast Fan-Content Policy. The views and opinions expressed in this post are strictly those of the author, and do not reflect the official position, policy, views, or opinions of Wizards of the Coast. No authors were compensated by any parties for the authorship of this post.
Welcome to the inaugural MTGATracker Report, a (soon to be) recurring series in which we’ll explore the aggregated game data collected from MTGA players using MTGATracker! This series will be published once per set (with an in-depth look into the past meta) and additionally, on a monthly basis, with a quicker look into the previous month’s data.
Why another meta report?
MTG Arena is young, but there are already a few great meta reports out there, written by really smart people. However, these reports are generated by humans using a limited set of unpublished data sources, and generally omit the methodology of collection. While it’s great to have human authors analyzing the meta from their perspectives, it is possible that even a group of contributors as large as ten or more will only see a subset of the full meta. We humans tend to be biased, fallible, and error-prone creatures (and gosh darn it if we don’t love good dragon art), so it’s also possible that individual authors may be writing about the decks they find the most interesting or appealing, rather than capturing the true state of the meta.
So… Why another meta report (and more importantly, why this one)? Well, the MTGATracker Report is backed by hard data, collected from a large and growing number of users. Our authors may choose to write about the things they find most interesting, but for everyone else, the data can tell it’s own story.
High-level Analysis
Report Volume
| Format | Games Tracked |
|---|---|
| Total | 49,474 |
| Limited† | 8,154 |
| Constructed† | 41,320 |
†Note that in this dataset, events are not tracked. We assume that any deck brought to a game with 60 or more cards is a constructed deck, while anything less is a limited deck. There may be some error here, but it is likely negligible; the sum of all decks with counts ranging between 50 to 59 cards is 182, or about 2% of the total number of games played with less than 60 cards. Note that with tracker version 3.5.5, event type is also tracked, to allow us to create even finer filters on MTGATracker data. Read more in the what's next section.
Games Over Time
This report includes data from 5/22/2018 (the day of the Dominaria patch) to 7/11/2018 (the day before the M19 patch). (Note the dip in records on 6/7-6/8, which represents MTGATracker’s short downtime following the KLD patch.)
It’s unsurprising that the weekends are the most popular days to play MTGA, but it’s a little odd that Tuesdays are also so popular:
Unique Decks vs. Unique Decklists vs. Unique Player Decklists
| Counting method | Number of Decks |
|---|---|
| Number of unique decks | 5,185 |
| Number of unique decklists (excluding lands) | 7,066 |
| Number of unique decklists (including lands) | 7,537 |
| Number of unique player decklists | 7,879 |
These may seem like odd distinctions to make, but they yield some interesting information, and are therefore worth differentiating. The table above goes from least restrictive to most restrictive; here when we say unique decks, we are referring to a deck a user has created, discounting all edits. If a user changes their land count, adds or removes cards, etc, but uses the same deck in Arena without deleting it, it is still the same deck. This first row doesn’t consider card contents at all.
On the other hand, a decklist refers to a specific set of cards. If a user creates a deck, plays a game with it, then swaps out a creature for an instant and plays another game, they have generated two unique decklists. However, the first distinction we make from decks is the set of unique decklists excluding lands completely. This means that if two decks are identical except that one only uses basic lands while the other uses rare dual-lands, we consider them to be the same deck for this category.
Next, unique decklists (including lands) refers to the number of unique sets of cards, including lands.
Finally, if two players converge on an identical decklist, they will together only contribute one count towards unique decklists; meanwhile, each will add their own distinct count to unique player decklists.
This data suggests a few interesting high level points:
- Players don’t frequently edit their decklists after creating them (on average, each deck is edited less than once!)
- Players converge around the same exact decklists relatively infrequently
We also dug a little deeper, and looked at the list of exact decklists most frequently converged upon by multiple players. Excluding mana bases, we found 13 exact decklists that ten or more players separately used in games. Eight of them were precons, two of them are slight variations on Mono Red Aggro, one RB Aggro, one UW Approach and finally one GW Go-Wide. This suggests that if players are netdecking, or even when players are provided with decklists, they prefer to customize them at least a little bit, rather than play them stock.
| Deck | Number of Users |
|---|---|
| Mono Red Aggro (v1)* | 30 |
| The Sun Empire | 20 |
| The Brazen Coalition | 20 |
| RB Aggro* | 17 |
| Selesnaya Pride | 15 |
| UW Approach* | 15 |
| Mono Red Aggro (v2)* | 14 |
| Azorius Ascension | 15 |
| Izzet Spellweaving | 12 |
| Golgari Exploration | 11 |
| Dimir Manipulation | 11 |
| Legion of Dusk | 11 |
| GW Go Wide* | 11 |
* = not a precon
Note that the two precons that didn’t show up were Boros Assault, and The River Heralds. Interpret this however you will.
Number of Cards per Deck
Download this dataset: [xlsx] [csv]
| Format | Average number of cards per deck |
|---|---|
| Limited | 40.59 |
| Constructed | 60.68 |
This data reveals that players tend to keep their deck sizes very tightly close to the minimum required size, on average including less than one extra card in both formats.
| Cards in deck | Games played |
|---|---|
| 40 | 7120 |
| 41 | 606 |
| 42 | 107 |
| 43 | 34 |
| 44 | 41 |
| 45 | 12 |
| 46 | 28 |
| 48 | 5 |
| 49 | 7 |
| 50 | 12 |
| 51 | 3 |
| 52 | 2 |
| 53 | 3 |
| 54 | 2 |
| 55 | 2 |
| 56 | 7 |
| 57 | 5 |
| 58 | 25 |
| 59 | 133 |
| Cards in deck | Games played |
|---|---|
| 60 | 38809 |
| 61 | 1158 |
| 62 | 429 |
| 63 | 193 |
| 64 | 114 |
| 65 | 132 |
| 66 | 54 |
| 67 | 34 |
| 68 | 54 |
| 69 | 16 |
| 70 | 15 |
| 71 | 30 |
| 72 | 20 |
| 73 | 23 |
| 74 | 12 |
| 76 | 7 |
| 78 | 67 |
| 81 | 5 |
| 82 | 1 |
| 85 | 3 |
| 86 | 3 |
| 90 | 9 |
| 91 | 15 |
| 97 | 5 |
| 126 | 5 |
| 143 | 9 |
| 250 | 98 |
There are also some funny outliers here; there are nearly
a hundred games played with a deck (or decks) that contain 250 cards! This writer
 isn’t quite sure if this is a
gimmick, a goof, or actually somewhat competitive, but to whoever you are out there running this legendary deck,
we salute you.
isn’t quite sure if this is a
gimmick, a goof, or actually somewhat competitive, but to whoever you are out there running this legendary deck,
we salute you.
Mid-level analysis
Win Rate by Deck Colors
In this section, we calculated the color of the hero’s deck for each game, and then counted how many times that deck won or lost.
Sort by Number of Games Recorded Sort by Win Rate
Individual Cards
Download this dataset: [xlsx] [csv]
| Grouping | Count | Percent |
|---|---|---|
| Total | 2,838,476 | – |
| Basic Lands | 792,785 | 27.9% |
| Non-Basic Lands | 337,168 | 11.8% |
| Creatures | 856,958 | 30.2% |
| Instants | 364,469 | 12.8% |
| Sorceries | 178,741 | 6.3% |
| Artifacts | 167,956 | 5.9% |
| Enchantments | 162,011 | 5.7% |
| Planeswalkers | 69,742 | 2.5% |
Most Frequently-Used Card Colors
In the following graphs, we looked at every card in every deck of every game (excluding all lands) within the time period to find out which colors are used most often.
Black is trying its hardest to keep up with red, but RDW seems to be dominating the meta like crazy.
It turns out that multi-colored cards are used relatively infrequently, and dramatically so. The most used multi-colored cards (UB, 17,475) make up only 14% of the least used single-color cards (which actually happen to be Colorless, 125,322).
Most Frequently-Used Cards: By Type
In this section, we’ll dig even deeper, and look at specifically which cards get used the most (and the least).
- Percent means percent of the category represented- for example, Aether Hub represents 7.6% of all non-basic lands.
- Average copies per deck means the average number used in any deck that uses at least one of a card.
Basic Lands
| Card | # Uses | % |
|---|---|---|
| Total | 792,785 | – |
| Mountain | 242,257 | 30.6% |
| Swamp | 178,833 | 22.6% |
| Forest | 125,727 | 15.9% |
| Island | 124,269 | 15.7% |
| Plains | 121,699 | 15.4% |
For anyone who’s been traversing the ladder, it should be no surprise that Mountains (the fuel to those slap-in-the-face Red Deck Wins) are the most popular basic land found in our tracked decks, followed not too closely by Swamps.
At time of writing, the most popular Standard deck on MTGGoldfish is Red Black Aggro, which could certainly be a major contributor to those two lands being used so heavily. BG Constructs / Counters (a personal favorite) has also been holding steady amongst the most popular decklists.
Thanks to the introduction of the Kaladesh block, it seems as if the ladder is leaning heavily towards
more aggressive, creature-heavy decks–in Red, Black, and Green–and gradually pushing those pesky
UB Control & UW Approach decks out of rotation. (At least, that’s what this writer  hopes for.)
Non-Basic Lands
| Card | # Uses | % | Average copies per deck |
|---|---|---|---|
| Total | 337,168 | – | – |
| Aether Hub | 25,655 | 7.6% | 2.8 |
| Field of Ruin | 18,723 | 5.6% | 1.6 |
| Glacial Fortress | 14,949 | 4.5% | 2.6 |
| Drowned Catacomb | 12,982 | 3.9% | 2.6 |
| Evolving Wilds | 12,977 | 3.9% | 2.1 |
Least-Used Non-Basic Land: Sequestered Stash was used a whopping 47 times! (This might sound sarcastic, but wait til you see the rest of the least-used numbers before you point and laugh.)
While our basic lands data suggests that those aforementioned pesky UB Control & UW Approach decks
are things of the past, our non-basic lands data…does not. Here, some staples of those decks are
still shown to be in heavy rotation: Field of Ruin, Glacial Fortress, Drowned Catacomb, and Evolving Wilds.
(It seems that this writer will still be losing some sleep over the thought of going head-to-head with a full
playset of Scarab Gods.)
It is, however, pretty intriguing that our top-used non-basic land is Aether Hub. Given the fact that our dataset only covers a little more than a month following the introduction of the Kaladesh block, it is abundantly evident that energy decks are still immensely popular- and even more tempting, it seems, than winning with an Approach of the Second Sun. But only by so much.
Artifacts
| Card | # Uses | % | Average copies per deck |
|---|---|---|---|
| Total | 167,956 | – | – |
| Bomat Courier | 23,513 | 13.9% | 3.5 |
| Walking Ballista | 18,340 | 10.9% | 2.9 |
| Scrapheap Scrounger | 13,923 | 8.3% | 3.7 |
| Heart of Kiran | 11,111 | 6.6% | 2.3 |
| Torrential Gearhulk | 8,929 | 5.3% | 2.4 |
Least-Used Artifact: Gilded Sentinel has the best golf score of all the robots and weapons, having a total usage count of just two.
Creatures
| Card | # Uses | % | Average copies per deck |
|---|---|---|---|
| Total | 856,958 | – | – |
| Goblin Chainwhirler | 28,053 | 3.3% | 3.3 |
| Soulscar Mage | 24,251 | 2.8% | 3.1 |
| Llanowar Elves | 23,907 | 2.8% | 3.2 |
| Bomat Courier | 23,513 | 2.7% | 3.5 |
| Hazoret the Fervent | 21,215 | 2.5% | 2.8 |
Hoo-boy, how about those Red Deck Wins, huh? A whopping four of our five most-decked creatures are staples of RDW, with the lone exception of Llanowar Elves.
Glory Seeker wins this round’s Least-Used Creature, with one use. Who doesn’t love a vanilla 2 cost 2/2? (Apparently everyone.)
Enchantments
| Card | # Uses | % | Average copies per deck |
|---|---|---|---|
| Total | 162,011 | – | – |
| Cast Out | 16,567 | 10.2% | 2.1 |
| Seal Away | 13,159 | 8.1% | 2.5 |
| Search for Azcanta | 10,657 | 6.6% | 1.7 |
| History of Benalia | 8,251 | 5% | 3.2 |
| Ixalan’s Binding | 7,304 | 4.5% | 1.7 |
Least-Used Enchantment: Blood Sun, with 4 uses total. Maybe someone pulled one in a quick draft and just wanted to play
their rares. This writer doesn’t really get it, but if this is you,
cheers to ya, and congrats on being mentioned in the Data Report!
Instants
| Card | # Uses | % | Average copies per deck |
|---|---|---|---|
| Total | 362,469 | – | – |
| Lightning Strike | 33,129 | 9.1% | 3.1 |
| Vraska’s Contempt | 25,886 | 7.1% | 2.6 |
| Abrade | 25,181 | 6.9% | 2.5 |
| Fatal Push | 23,571 | 6.5% | 2.9 |
| Cast Down | 17,525 | 4.8% | 2.1 |
Bright Reprisal takes the spot for Least-Used Instant, coming in hot with two whole uses!
Planeswalkers
| Card | # Uses | % | Average copies per deck |
|---|---|---|---|
| Total | 69,742 | – | – |
| Karn, Scion of Urza | 16,556 | 23.7% | 2.0 |
| Chandra, Torch of Defiance | 12,989 | 18.6% | 2.0 |
| Teferi, Hero of Dominaria | 12,463 | 17.8% | 2.6 |
| Liliana, Death’s Majesty | 5,722 | 8.2% | 1.4 |
| Gideon of the Trials | 4,869 | 6.9% | 1.5 |
Trailing the pack (by quite a lot), we have the Least-Used Planeswalker: Angrath, Minotaur Pirate, who was only taken to the ball-game twice. :(
Sorceries
| Card | # Uses | % | Average copies per deck |
|---|---|---|---|
| Total | 178,741 | – | – |
| Doomfall | 14,836 | 8.3% | 2.2 |
| Duress | 9,062 | 5% | 2.3 |
| Fumigate | 8,509 | 4.7% | 2.3 |
| Adventurous Impulse | 7,439 | 4.1% | 2.4 |
| Golden Demise | 6,492 | 3.6% | 1.8 |
Least-Used Sorcery: Dubious Challenge, used only once!
Most Frequently-Used Cards: By Rarity
Commons
| Card | # Uses | % | Average copies per deck |
|---|---|---|---|
| Total | 515,979 | – | – |
| Llanowar Elves | 23,907 | 4.6% | 3.2 |
| Magma Spray | 16,235 | 3.1% | 2.6 |
| Shock | 16,224 | 3.1% | 2.9 |
| Fanatical Firebrand | 16,082 | 3.1% | 3.3 |
| Essence Scatter | 12,633 | 2.4% | 2.3 |
Glory Seeker gets the wrong kind of glory, winning both Least-Used Creature, and Least-Used Common, again with only two uses.
Uncommons
| Card | # Uses | % | Average copies per deck |
|---|---|---|---|
| Total | 686,066 | – | – |
| Lightning Strike | 33,129 | 4.8% | 3.1 |
| Aether Hub | 25,655 | 3.7% | 2.8 |
| Abrade | 25,181 | 3.7% | 2.5 |
| Fatal Push | 23,571 | 3.4% | 2.9 |
| Ahn-Crop Crasher | 20,827 | 3% | 2.9 |
Ahn-Crop Crasher is the only new card on this list, coming in with 3% of the share of all uncommon cards used.
Dessicated Naga earns its title, as the Least-Used Uncommon with just one use.
Rares
| Card | # Uses | % | Average copies per deck |
|---|---|---|---|
| Total | 634,354 | – | – |
| Goblin Chainwhirler | 28,053 | 4.4% | 3.3 |
| Vraska’s Contempt | 25,886 | 4.1% | 2.6 |
| Soulscar Mage | 24,251 | 3.8% | 3.1 |
| Bomat Courier | 23,513 | 3.7% | 3.5 |
| Earthshaker Khenra | 20,620 | 3.2% | 3.5 |
Earthshaker Khenra is the only card in this category that has not already appeared in a top-5 list. Meanwhile, Dubious Challenge makes a reappearance as the Least-Used Rare, again with one use.
Mythic Rares
| Card | # Uses | % | Average copies per deck |
|---|---|---|---|
| Total | 209,292 | – | – |
| Hazoret the Fervent | 21,215 | 10.1% | 2.8 |
| Karn, Scion of Urza | 16,556 | 7.9% | 2.0 |
| Rekindling Phoenix | 15,336 | 7.3% | 2.3 |
| Chandra, Torch of Defiance | 12,989 | 6.2% | 2.0 |
| Teferi, Hero of Dominaria | 12,463 | 5.9% | 2.6 |
Rekindling Phoenix makes it’s debut on a top-5 list in the Most Used Mythic Rare category! And sad Angrath, Minotaur Pirate joins us yet again- this time as the Least-Used Planeswalker, again with just two uses. (Angrath, Minotaur Pirate has decided to change his name to Sadgrath, Minotaur Pirate as he is no longer angry and wrathful, but instead… just kinda sad and wrathful.)
Final Remarks & What’s Next
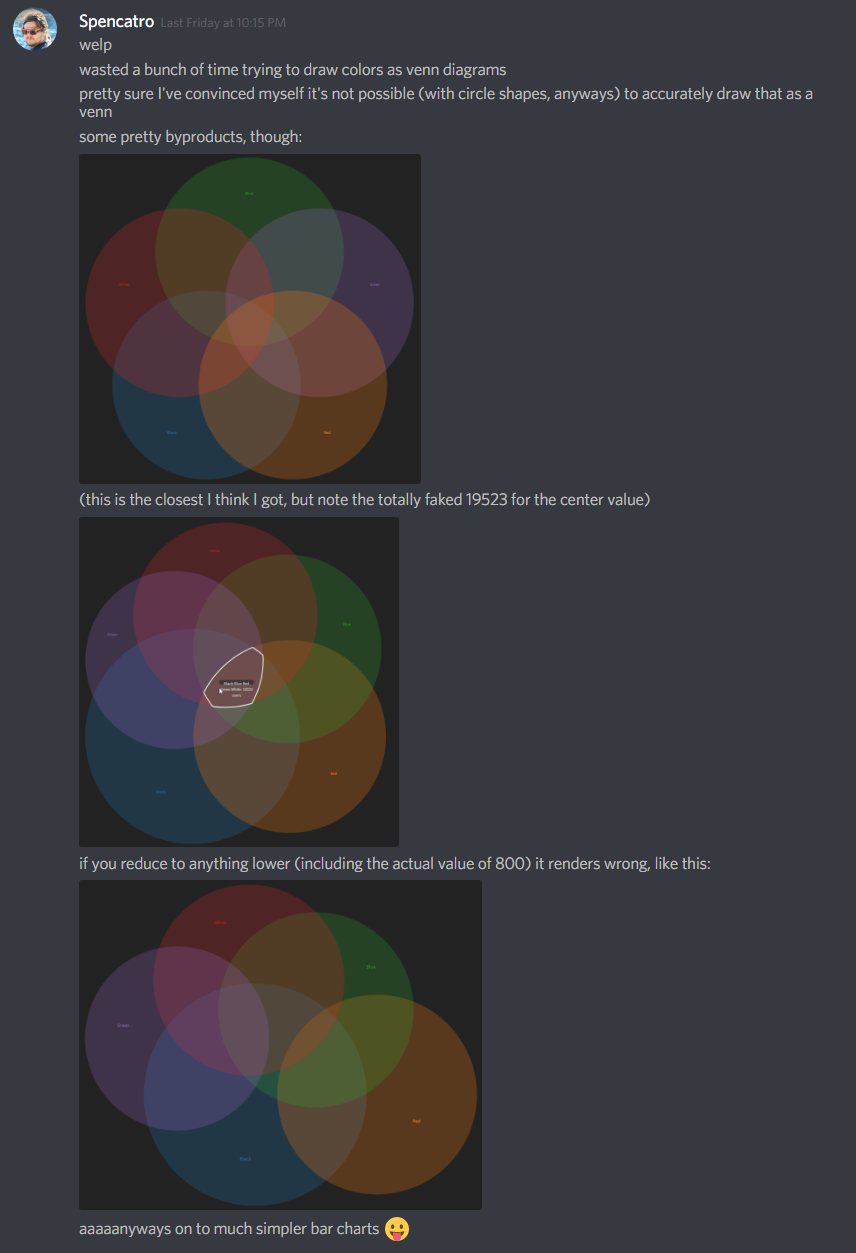
There were a lot of things we tried to do in this report that didn’t make it to the final draft. For example, some of the visualisations we tried didn’t quite work out (like these very pretty, but also both impossible and quite useless venn diagrams). Some of the things we did do also didn’t tell us quite as much as we would have liked; for example, while the exact decklist comparisons revealed some aspects of player tendencies, they don’t say very much about the state of the ladder. We’re going to keep thinking about different ways we can get more useful info out of this data, and keep improving our process for making these reports. This first round was a pretty grueling, but ultimately fun & challenging experiment that we’re excited to keep refining.
Here are some of the new things we’re already set up to write about in the next data report:
Event Tracking
As of MTGATracker version 3.5.5, we now record the specific event each game takes place in. This means we’ll be able to filter data with even more accuracy.
Cards listed vs. Cards played
MTGATracker now also records which cards a player draws and has the opportunity to play, instead of just recording their entire submitted decklist. We think this will generally be more useful to individual players hoping to determine which cards help propel their own decks to victory, but maybe it will have some use in the aggregate as well.
Timing analyses
We’re really excited about this one! Since MTGATracker now tracks the amount of time each player holds priority, we can use aggregate data to find the “fastest” and “slowest” decks to play. (While I’m sure we can all guess what the former will be (*cough, monored*), it will be fun to get hard data backing it up.)
Deck similarity analyses
These writers  are cooking up all kinds of great ideas on how we can better relate decks to each other. While
we found some interesting player habits by looking at exact decklists, this doesn’t tell us as much about
the standard format as we would like. We’re even looking into leveraging crazy things like machine learning &
neural networks to accurately (and exhaustively) categorize the most popular decks in the meta.
are cooking up all kinds of great ideas on how we can better relate decks to each other. While
we found some interesting player habits by looking at exact decklists, this doesn’t tell us as much about
the standard format as we would like. We’re even looking into leveraging crazy things like machine learning &
neural networks to accurately (and exhaustively) categorize the most popular decks in the meta.
Your input?
Have other ideas for metrics we should track and write about? Want to join the meta-report team, and write about the intersection of MTG and Data? Let us know in Discord!
A new meta?!
This one probably goes without saying; it will be interesting to see how much the meta shifts (if at all) with the release of Core 2019.
This writer speculates Red will
continue to dominate, especially with the re-release of Banefire, which will
severely hamper Control’s ability to lock down the game. Additionally, he sees Mono-White becoming an attractive
Aggro deck with the release of Valiant Knight, and even sees it potentially becoming the go-to Aggro deck come rotation.
This writer just wants to see more dragons.
Addendum: Collection Methodology
All the data shown in this report is real data aggregated from MTGATracker users. When MTGATracker observes the conclusion of a game in MTGA, it uploads some data to MTGATracker servers, including the following (which has been truncated for simplicity):
{
  "players": [{
    "name": "Spencatro",
    "deck": {
      "poolName": "The Brazen Coalition",
      "deckID": "...R3D4CT3D...",
      "cards": {
        "65081": 2,
        "65463": 2,
        "65643": 1,
        // ...
        "66929": 2,
        "67019": 9,
        "67021": 12
     },
    }
  },
  {
    "name": "Opponent's MTGA Username",
    "deck": {
      "poolName": "Opponent's MTGA Username's visible cards",
      "deckID": "unknown",
      "cards": {
        "-1": 39,
        "66003": 2,
        "66009": 1,
        "66029": 1,
        // ...
        "66619": 2,
        "66627": 2,
        "66631": 2
      }
    }
  }]
}
The five digit numbers in these records each refer to a unique MTGA card’s grpId, a unique ID used internally in
MTGA. For these data reports, MTGATracker data scientists (Spencatro and MatteyRitch) write queries against
the MTGATracker database to get the aggregate information shown here. Once we have the aggregate data, we can
decode grpIds using MTGATracker’s open-source mtga python module.
The resulting data sets are then published here, when it is possible to do so without violating individual users’
privacy. (We will never expose a single user’s unique decklist without their express permission!)
Thanks for reading! Until next time… keep trackin’ on!